Quarterly Newsletter 1st Quarter 2021

Rotation
by Daniel Eye
Market Update
Equity markets got off to a strong start in 2021, rising for a fourth straight quarter. The S&P 500 Index advanced by 6.2% while posting multiple new all-time highs along the way. The market remained very positive on reopening progress and improving high-frequency economic data amid an accelerating COVID vaccination pace. Heightened fiscal stimulus expectations also boosted investor sentiment and drove upside revisions to economic growth forecasts. Meanwhile, the U.S. Federal Reserve showed no signs of reversing course from their ultra-accommodative policies.
Fixed income markets reacted negatively to the rebound in economic growth, rising inflation expectations and a sharp increase in bond issuance to fund government spending and deficits. Closely watched 10-year Treasury bond yields doubled during the first quarter, resulting in significant price declines for long-maturity bonds.
The table below shows the difference in first quarter performance results for short-maturity versus long-maturity bonds. Our short duration stance and avoidance of measurable exposure to long-maturity bonds were not optimal in 2020, but helped buffer fixed income allocations from more significant declines this quarter.
| Q1 2021 | |
| Benchmark | Performance |
| 2-Year Treasury | -0.04% |
| Bloomberg/Barclays Credit 1-5 Yr Index | -0.57% |
| 5-Year Treasury | -2.46% |
| Bloomberg/Barclays US Corp Bond Index | -4.65% |
| 10-Year Treasury | -7.02% |
| Bloomberg/Barclays US Long Credit Index | -8.39% |
| 30-Year Treasury | -15.84% |
Source: J.P. Morgan Asset Management and Morningstar.
Below is a summary of first quarter performance results for several major indices:
Economic Update
The pace of the economic recovery was uneven in the first quarter, with some setbacks due to a new spike in COVID cases in mid-January and harsh weather in February. However, data strengthened significantly in March, indicating that we may now be entering the “liftoff” phase of the recovery. The March employment report combined with previous months’ positive revisions showed an addition of more than 1 million workers to the payrolls. Readings on both the manufacturing and services sides of the U.S. economy jumped to multi-decade highs in the final month of the quarter. And “in-person” consumer spending activity has now almost fully recovered to pre-pandemic levels.
Given this broad and intensive upgrade in economic activity, it appears we are seeing the inflection point where accumulated excess savings and spending potential are beginning to be deployed.
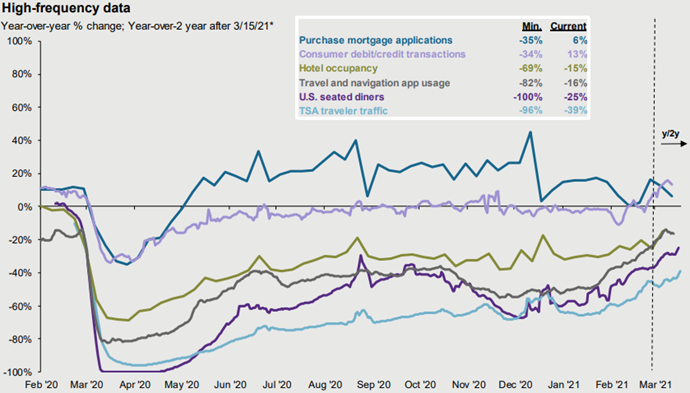
The next chart provides a good visual summary of the economic recovery’s progress. Areas such as consumer spending and home purchases have more than fully recovered. And while activities such as air travel and restaurant dining are still well below pre-pandemic levels, there has been a massive improvement from the depths of the declines in March and April of 2020.
Source: App Annie, Chase, Mortgage Bankers Association (MBA), OpenTable, STR, Transportation Security Administration (TSA), J.P. Morgan Asset Management. *Beginning March 15, 2021, all indicators compare 2021 to 2019. Prior to March 15, 2021, figures are year-over-year. Consumer debit/credit transactions, U.S. seated diners and TSA travelers traffic are 7-day moving averages. App Annie data is compared to 2019 average and includes over 600 travel and navigation apps globally, including Google Maps, Uber, Airbnb and Booking.com. Consumer spending: This report uses rigorous security protocols for selected data sourced from Chase credit and debit transactions to ensure all information is kept confidential and secure. All selected data is highly aggregated and all unique identifiable information – including names, account numbers, addresses, dates of birth and Social Security Numbers – is removed from the data before the report’s author receives it. Guide to the Markets – U.S. Data are as of March 31, 2021.
Closing Thoughts
At this point, surges in both GDP and corporate earnings are pretty much “baked in” for investors in 2021. In fact, the combination of unprecedented fiscal stimulus, excess savings and significant pent-up demand could translate into an overheated economy as the year progresses. A booming economy is not all good news, however. It could become a headwind for equity markets if soaring inflation causes a reversal of the Federal Reserve’s highly stimulative policies. While we are not at that inflection point yet, we’re closer than we were three months ago.
A Billion Here, a Billion There
“A billion here, a billion there and pretty soon you’re talking real money.” Former Senator Everett Dirksen likely never contemplated spending in the trillions when he made this famous comment. Thus far in fiscal 2021, however, the Trump and Biden administrations have added $2 trillion in COVID relief to the trillions spent in 2020. The U.S. Federal Reserve is getting its wish for ongoing fiscal injections, so they don’t have to carry the whole load of supporting the U.S. economy. All the central bank has to do is keep the money flowing – and they’re doing it.
As a result, the bond market is struggling to find its rightful place in the world. All this spending and money printing points to higher inflation down the road, the prospect of which created a historically bad quarter for long-term bonds. According to Grant’s Interest rate Observer, over the first three months of 2021, the 30-year U.S. Treasury bond suffered a negative total return of 15.66%, its worst quarterly showing since inflation-wracked 1976. Investment-grade corporate bonds did slightly better, generating a negative total return of about 3%. On the other side of the coin, the most speculative junk bonds thrived, with triple-C-rated corporate bonds returning a positive 4% for the quarter.
The main reason for this disconnect can be found in the details of the aforementioned $2 trillion stimulus package. The fine print shows prodigious amounts of money directed to the most leveraged parts of the economy. Poorly managed states, municipalities and pension funds, for example, were rewarded for their fiscal profligacy with tens of billions of dollars in COVID relief funds. Their (previously) highly speculative securities were thus given a lifeline, allowing a least some of them to (theoretically) pay off debt in coming months. Hopefully some of this money will be used to shore up faulty finances once and for all, but we’re not holding our breath.
For the first quarter of 2021, most fixed income indices ended negative. The BarCap Aggregate Index ended lower by 3.37%. The BarCap 5-10 year Municipal Index was lower by .52% and the BarCap 1-5 year Corporate Index was lower by .51% for the quarter.
Quarterly Review
by Denny Baish
Domestic and international equity indices posted gains in the first quarter of the year. Large market capitalization U.S. companies, represented by the S&P 500 Index, rose +6%. Domestic small-cap companies, represented by the Russell 2000 Index, led all domestic market capitalizations and gained +13%. International equities posted positive results in the quarter as well. The MSCI EAFE Index, a proxy for international developed stocks, finished the quarter with a +3% return. The MSCI Emerging Market Index, a proxy for developing countries, gained +2%.
U.S. stocks hit record highs in March as investors cheered positive news. COVID-19 cases declined throughout the quarter and daily doses of the vaccine being administered continued to increase. Positive news on the virus and restrictions being lifted in some areas of the country gave hope that the economy would continue its recovery. The Federal Reserve says GDP growth in the U.S. is expected to increase 6.5% in 2021, which would be the highest in more than 30 years. Another round of fiscal stimulus also provided hope the economy would continue to rebound. The American Rescue Plan Act of 2021, a $1.9 trillion economic stimulus bill passed by Congress and then signed by President Biden in March, provided additional relief to most Americans. The bill provided a new round of stimulus checks of $1,400 for individuals making less than $75,000, couples making less than $150,000, and $1,400 for each dependent. In addition to direct payments to individuals, the bill also increased the child tax credit, extended the weekly jobless aid, provided relief to state and local governments, allotted funds to vaccine manufacturing and distribution, among other things. Also, during the quarter, the Federal Reserve continued with its accommodative policy of low interest rates and bond purchases even as Fed Chair Jerome Powell acknowledged that inflation is likely to rise as the economy recovers.
Much like the broad equity indices, the underlying domestic equity categories had strong performance in the first quarter. As mentioned above, domestic small-cap companies, represented by the Russell 2000 Index, led the way, and gained +13%, while mid-caps added +8%. Large-capitalization companies, represented by the Russell 1000 Index, finished the quarter with a gain of +6%. For the second consecutive quarter, value indices outpaced growth indices across all market capitalizations. Large value gained +11% and surpassed its growth counterpart by +10%. Small value returned +21% and outpaced small growth by more than +16%. Mid value gained +13%, while mid growth lost -1%.
The fixed income segments posted mixed results in the quarter. The U.S. high yield bond market, represented by the Bloomberg Barclays U.S. Corporate High Yield Bond Index, finished with a gain of +1%. Most of the other fixed income segments ended the first three months of the year with losses as yields rose. Long-term government bonds, represented by the Bloomberg Barclays U.S. Long Government Index, finished the first quarter with a loss of -13%. The Bloomberg Barclays U.S. Aggregate Bond Index, a proxy for the overall investment grade U.S. fixed income market, finished the quarter with a -3% return.


